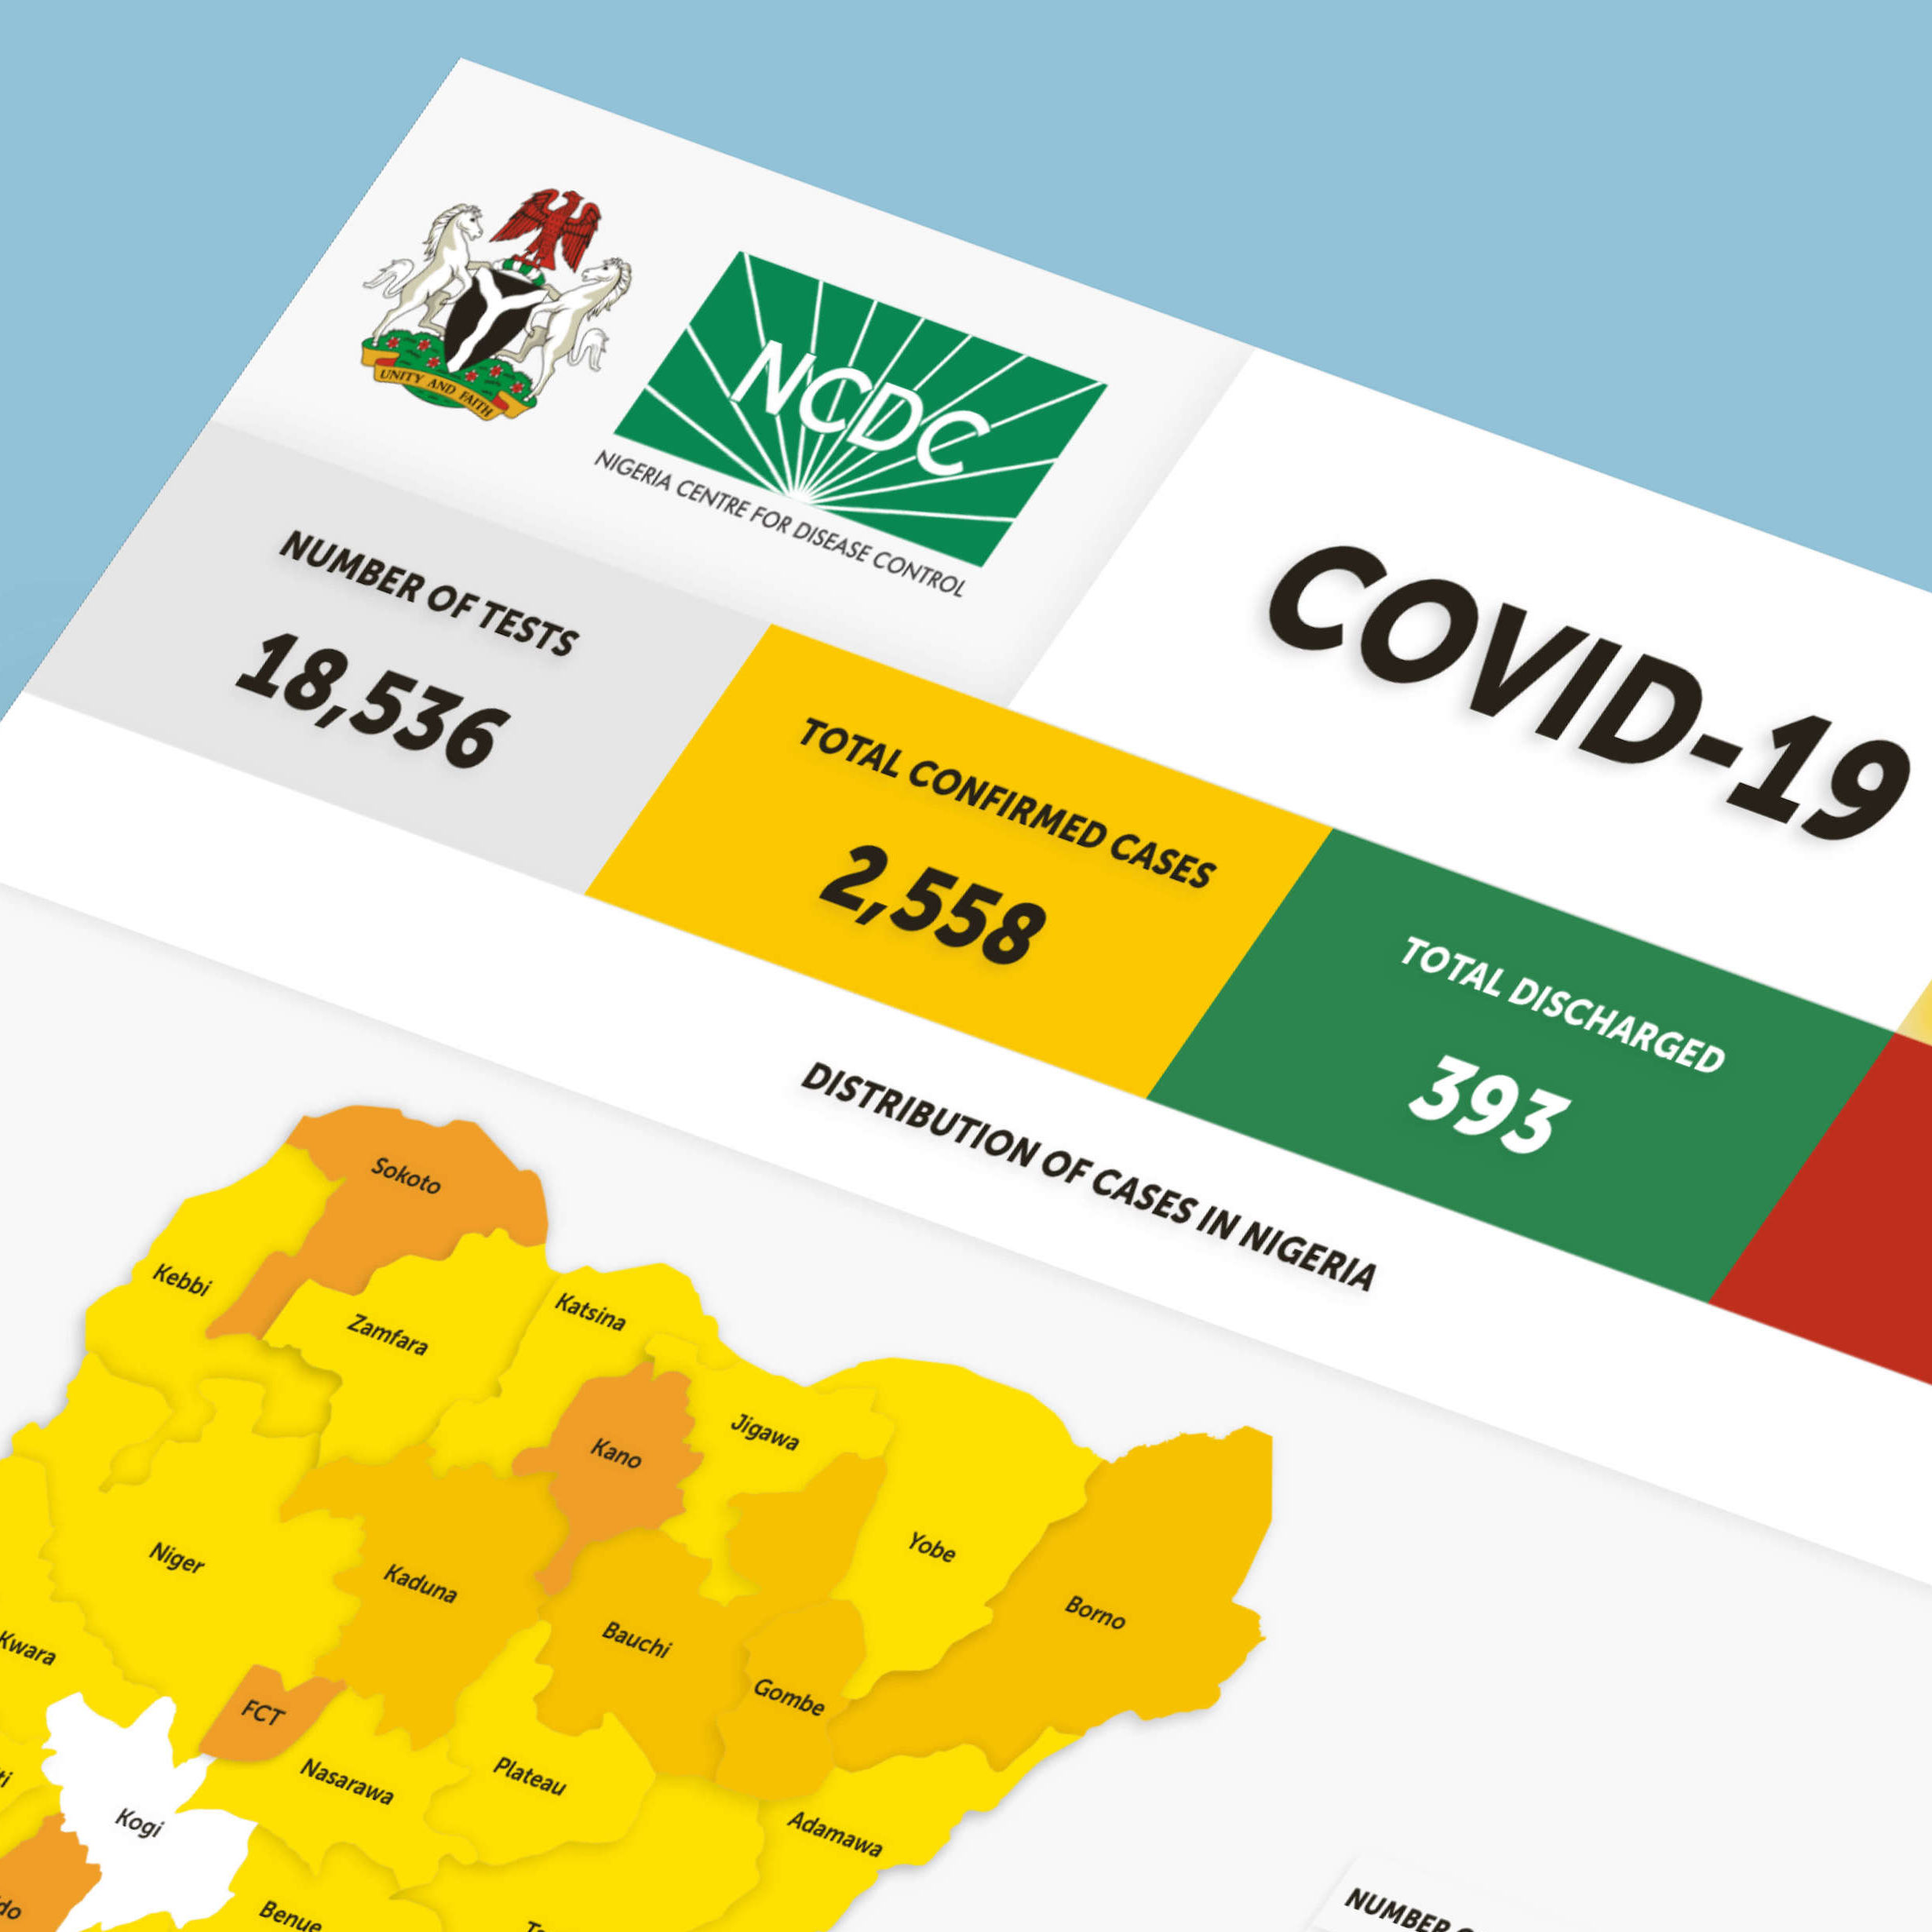
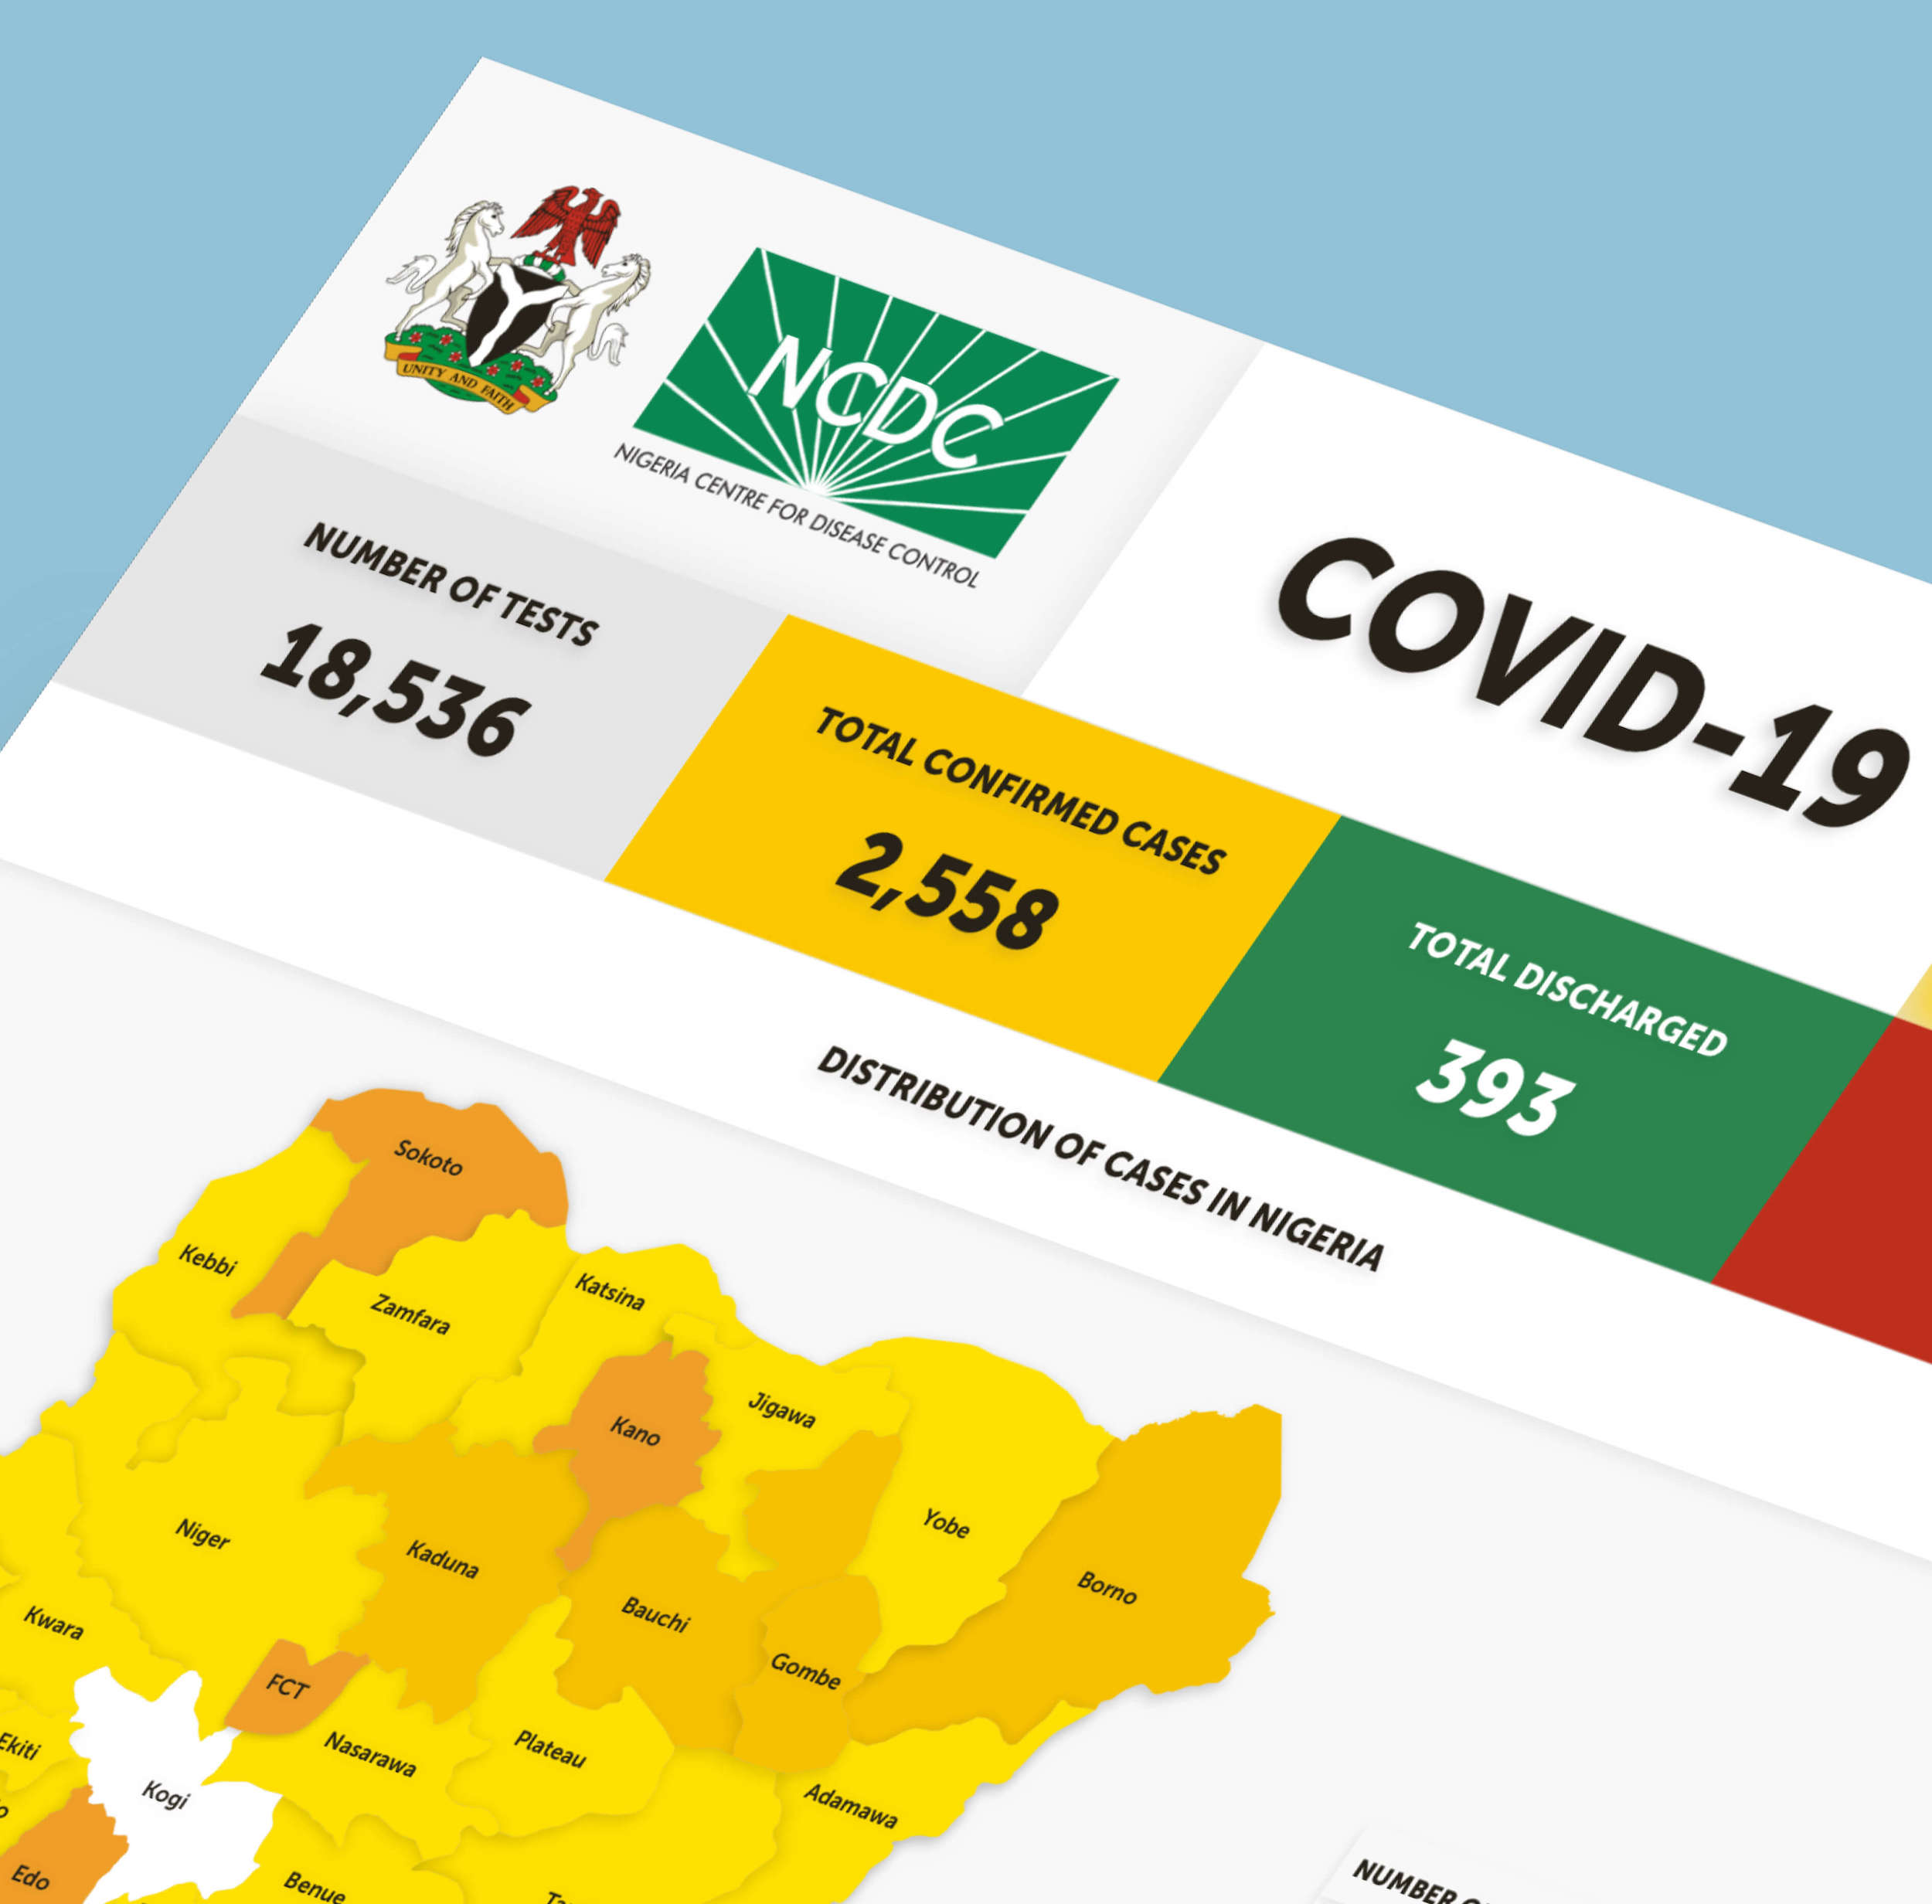
NCDC Covid-19 Infographics
We redesigned the NCDC infographic that summarizes the crucial data during the COVID pandemic. We observed a number of visual inconsistencies that made the original infographics difficult for the public to comprehend, so we decided to create an improved version.

Afterwards, we designed the infographics. In this case, we set out to create an infographic that’s digestible and easy on the eyes.
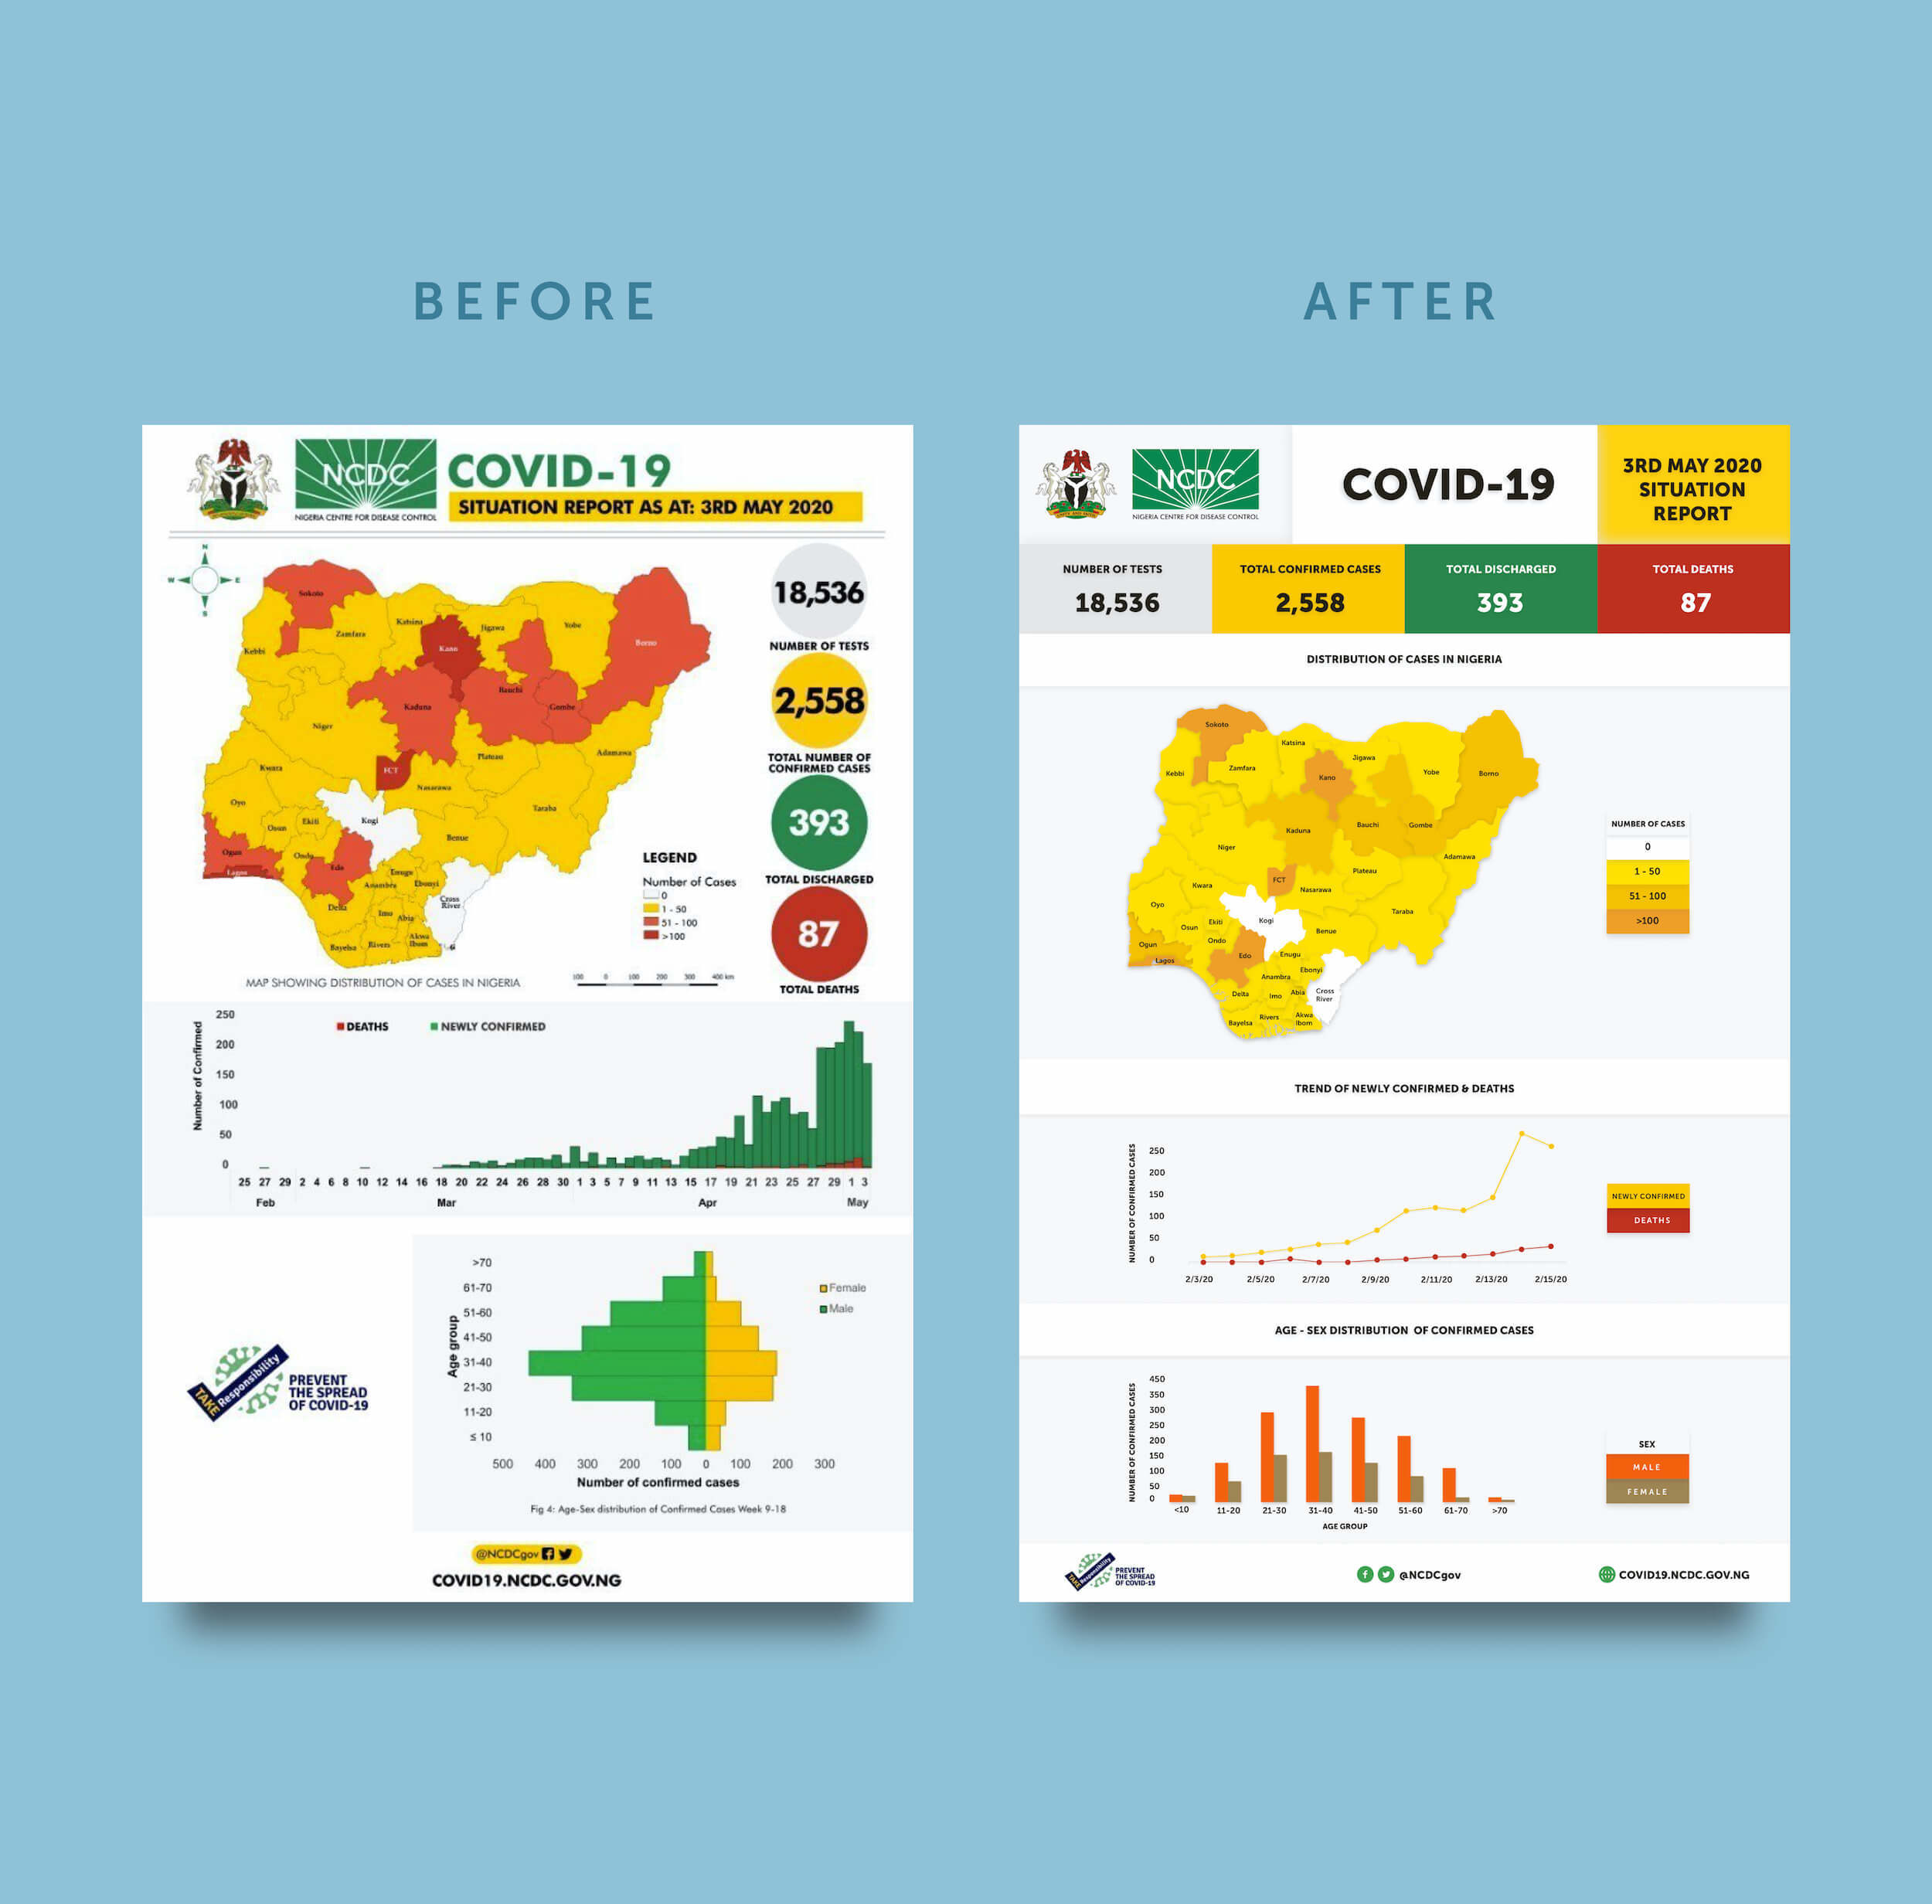
To achieve this intention, we made a number of updates which included:
1. Highlighting the main figures
2. Giving each graph its own space
3. Giving each graph a top title
4. Standardizing the legends
5. Using colors appropriately
6. Making the graphs easier to understand by updating them & standardizing their y-axis
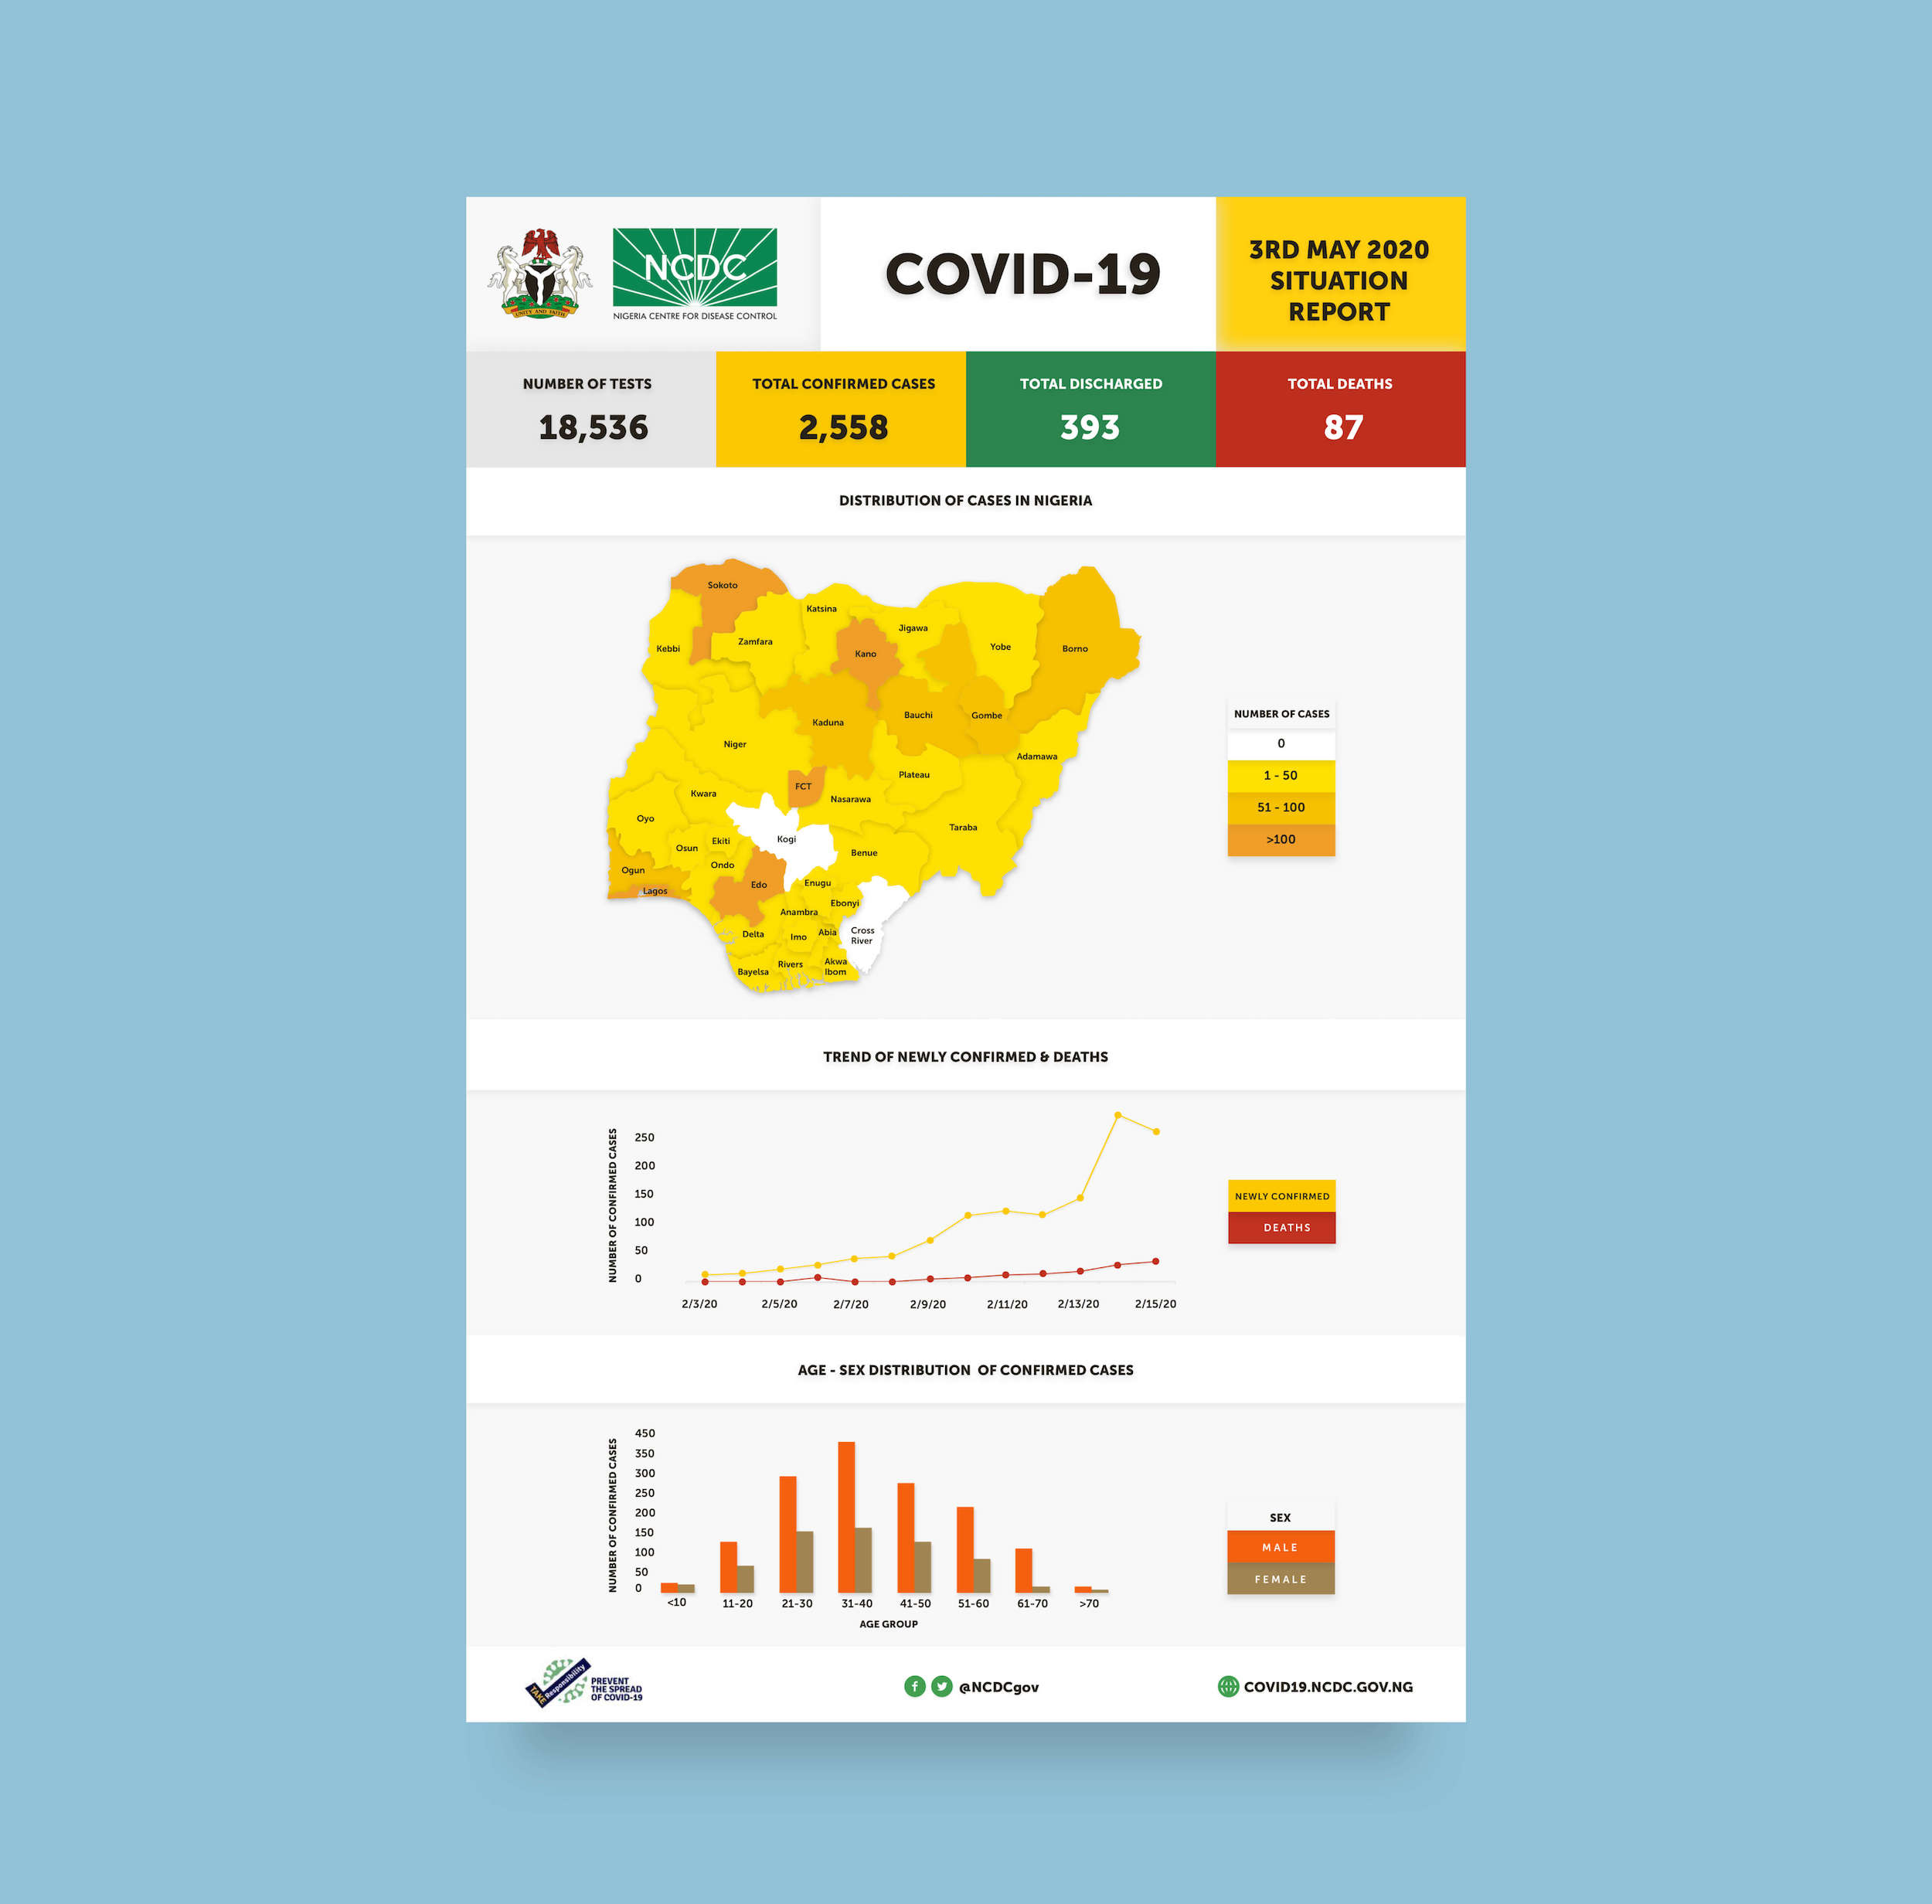
As with everything else we design, each element in our infographics is created from a place of intention. Like our use of colors to ensure ease of understanding, we were intentional about applying shadows and textures across the infographic.
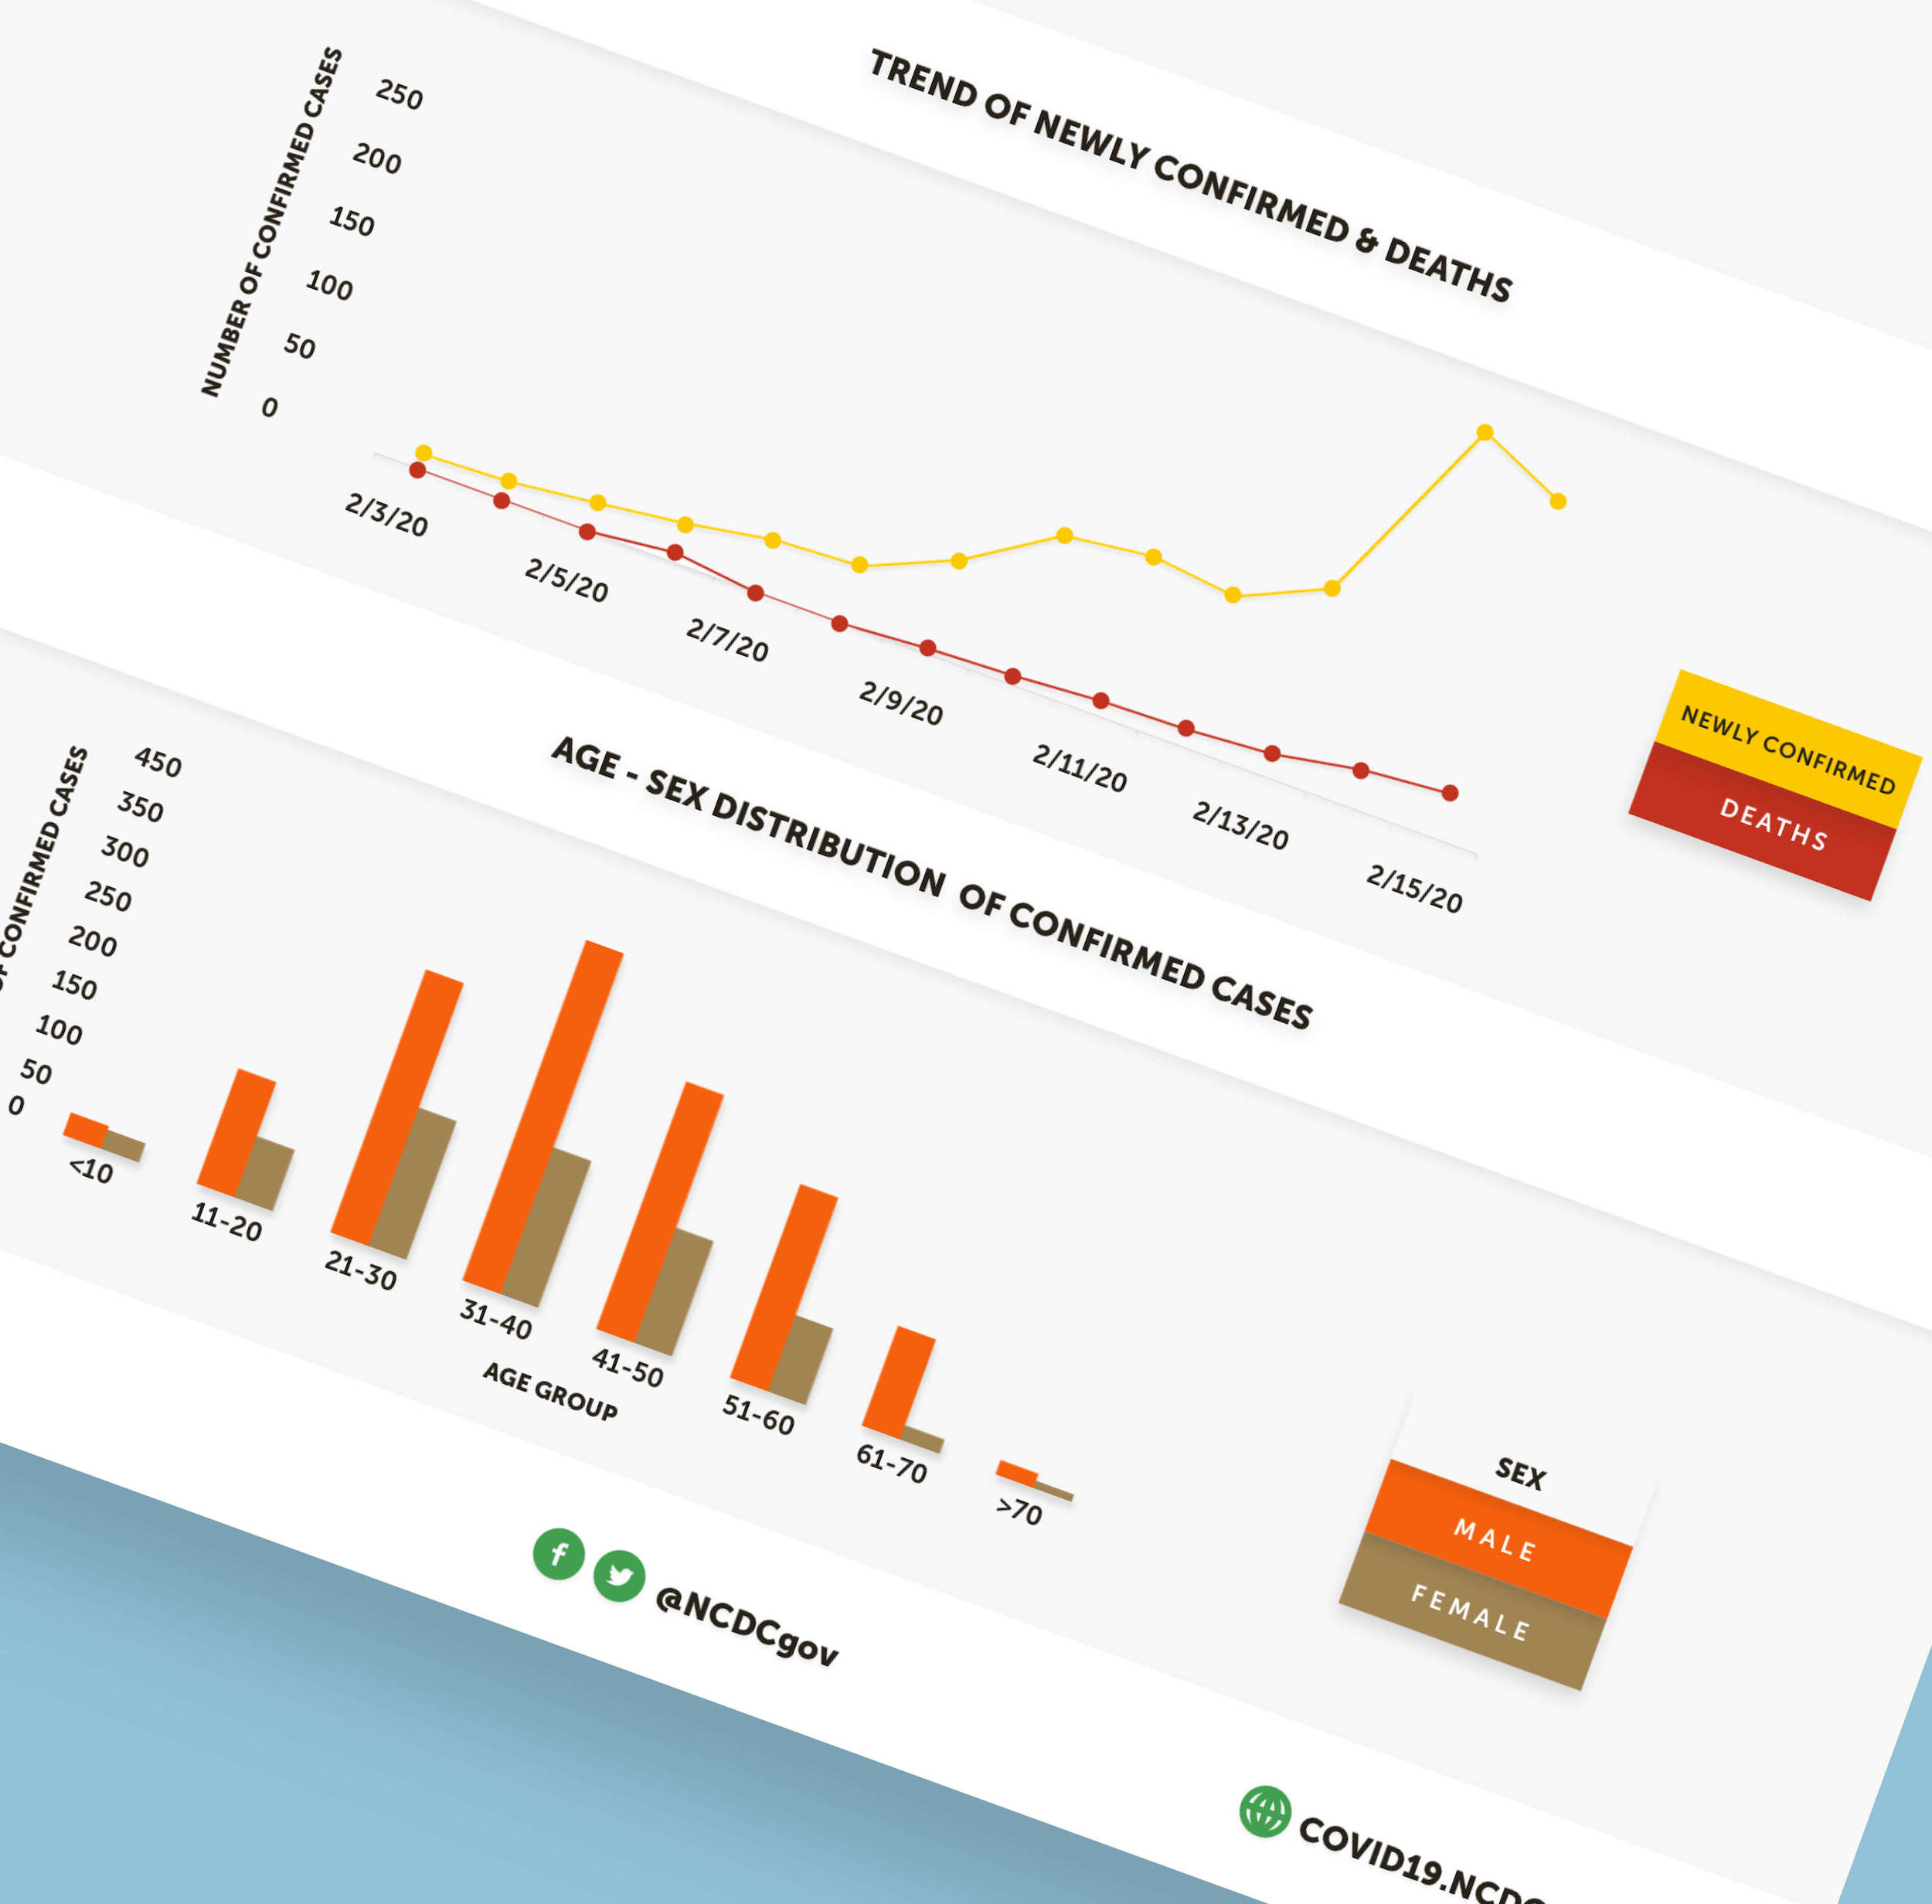
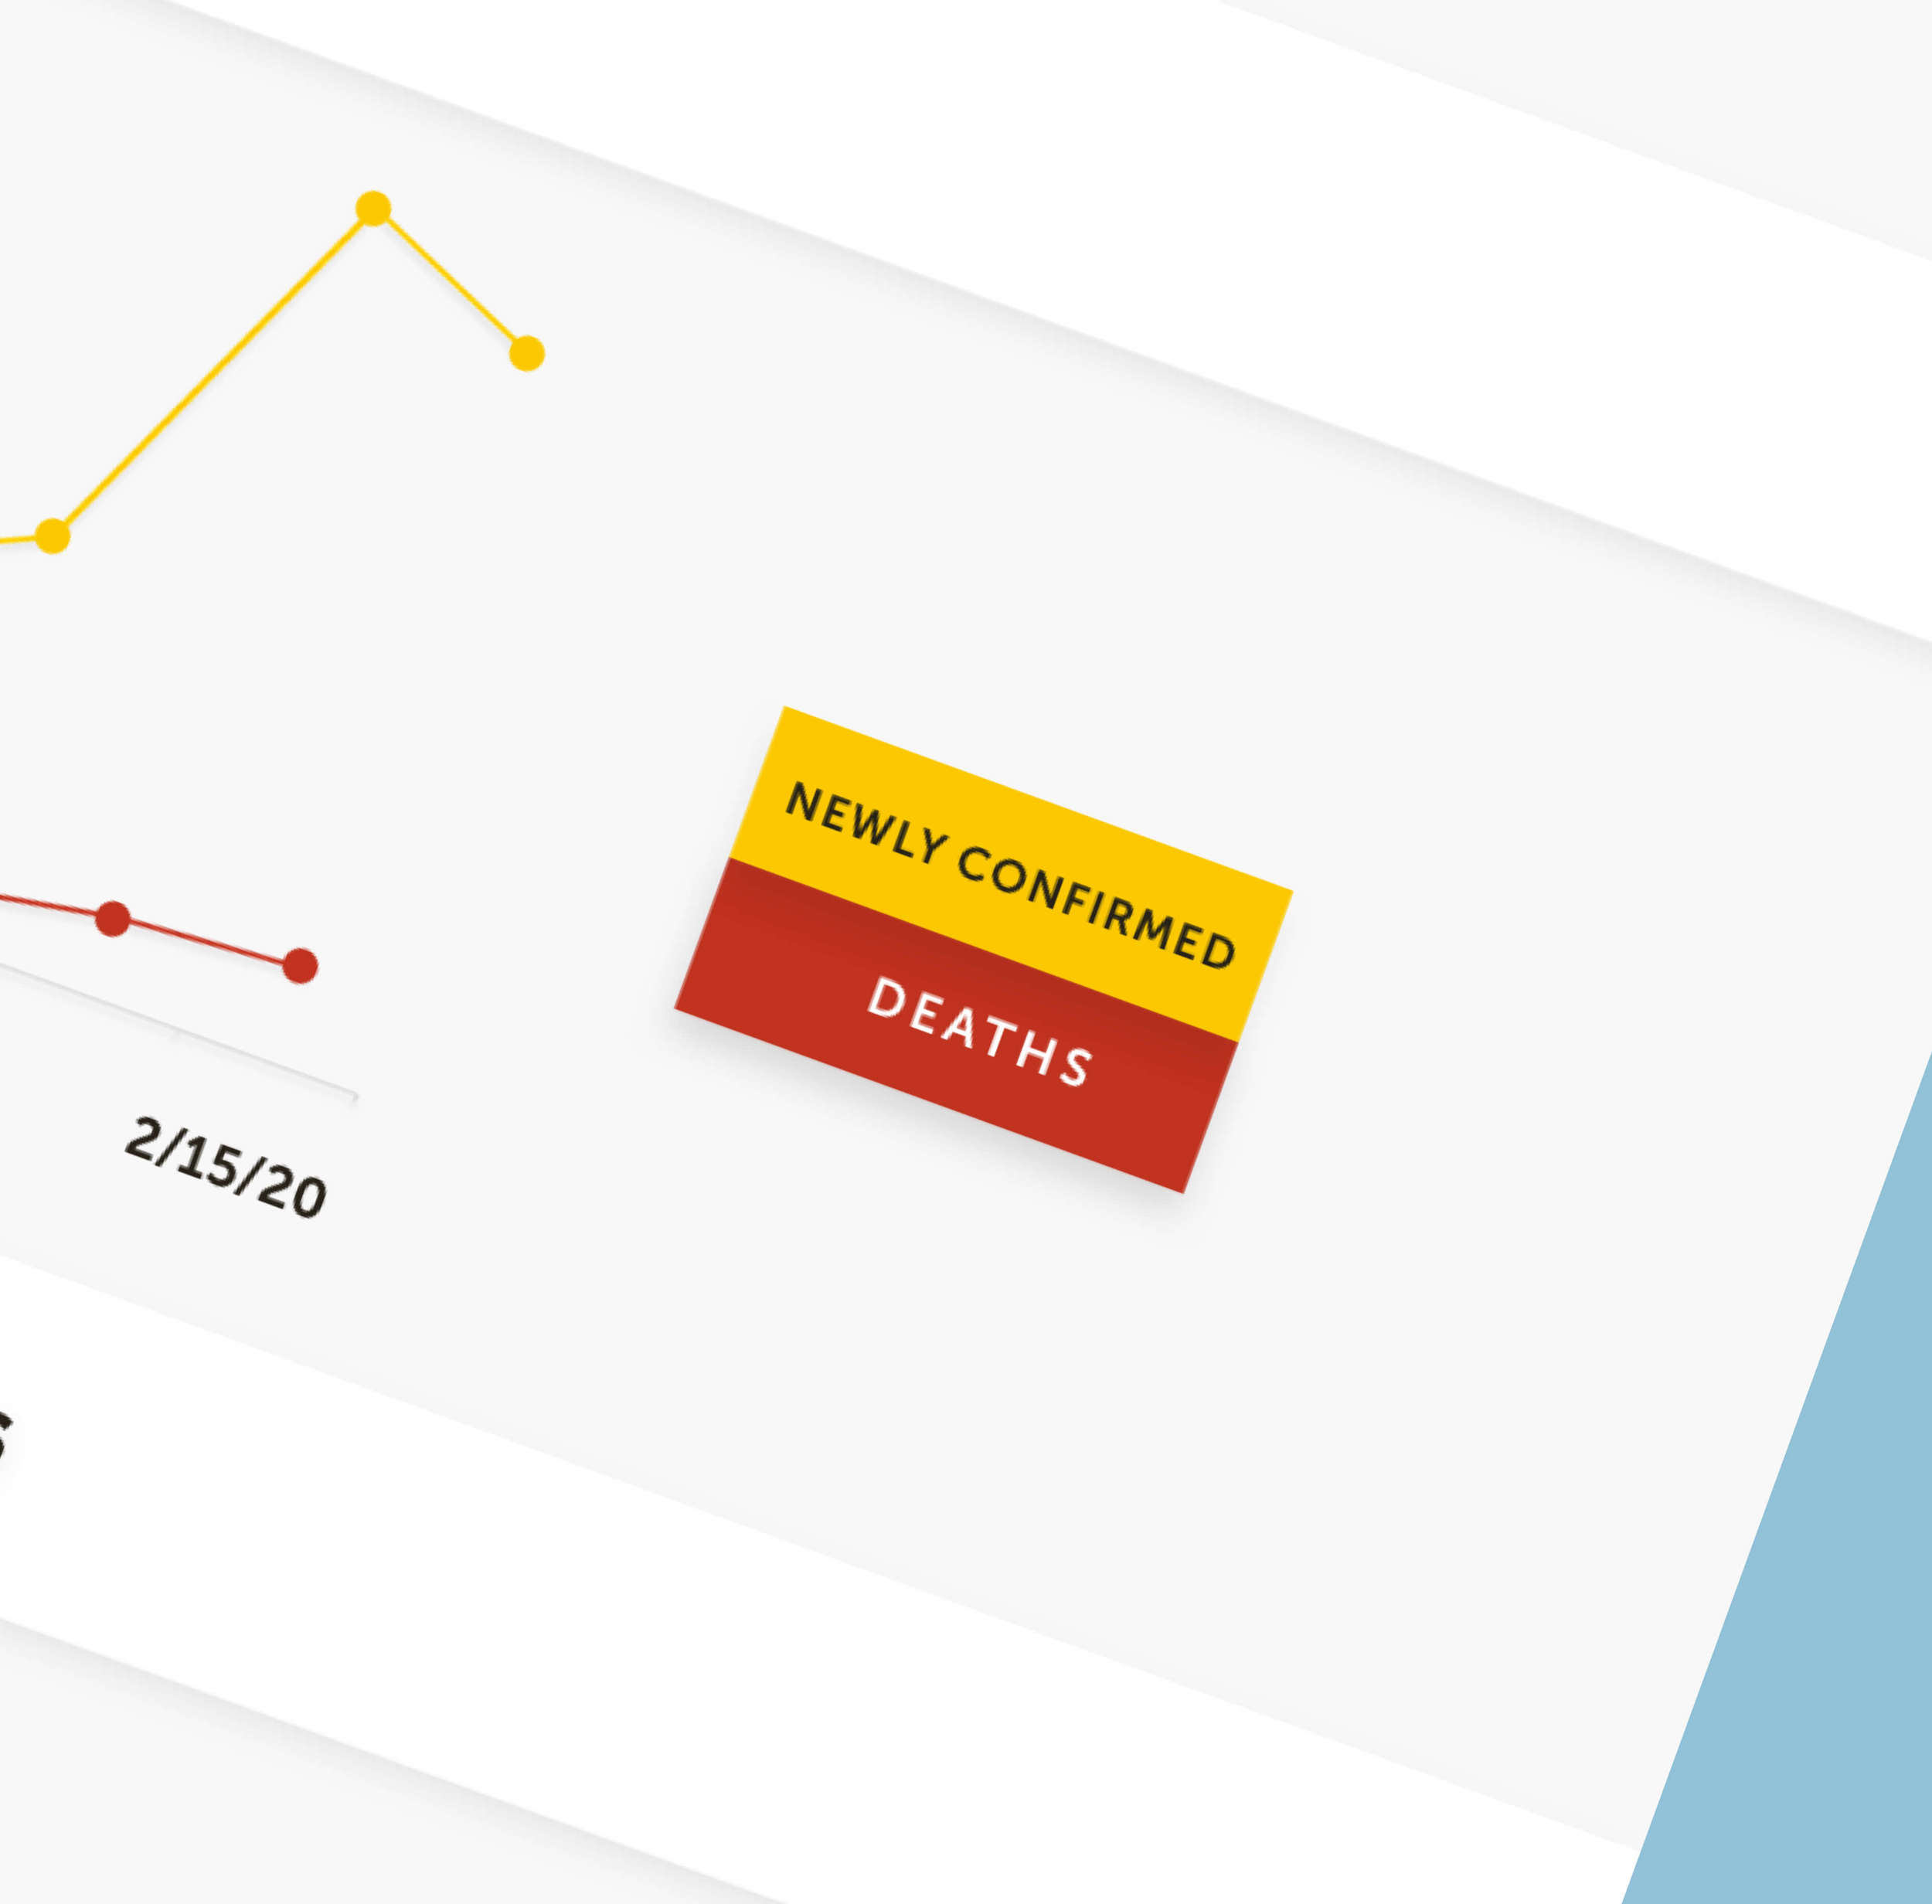
We used shadows because they add depth and a deeper feeling of interaction to each element. Essentially, each element evolves from simply appearing visual to also appearing tactile. The feeling of tactility is important because it’s reminiscent of being a child with the innate habit of exploring things through touch. This invokes the childlike happiness of discovering something new. It also creates a jigsaw-like feeling which invites the viewer to play. This is all in line with how we design everything for happiness. Also, by using shadows, we avoided using black lines to delineate the elements, which results in a more pleasing, minimalist interface.
A couple of days after we released the new infographic, the NCDC adopted a number of the recommendations we made.
